Apple watch and swimming


No not manually ….

If you have an Apple Watch 2 /3 or and you use Strava you’ll be as frustrated as I am that Strava doesn’t support swimming on the watch. You have to record any swim that you do using the watch’s native Workout app (which works really well), then manually create a new activity in Strava and fill in the details. There is quite a thread developing on the Strava Support forum requesting swim support for Apple Watch 2 / 3 and I would urge you to add your name to it. However, I have just discovered the Swim Exporter app that connects with Apple Health and Workout data and imports the information into Strava when you record either a pool swim or an openwater swim using the Workout app. It costs £1.99 and is incredibly simple to use: simply connect it to your Health app and link it to Strava and it will automatically display all swim workouts. To upload a workout to Strava, just click on the workout and click, “Send to Strava”. Job done.

Website: http://stickybit.co.nz/swimexporter/

Apple Store: https://itunes.apple.com/app/swim-exporter/id1227272243

Shame Strava don’t do a swim part for their watch app

Veloviewer gets better and better (if you use Strava)


VeloViewer has always been able to show you comprehensive views of your past rides and runs but plenty of people had asked to see similar views of routes they are planning to do. Fortunately Strava have just opened up their Routing API so now Veloviewer can display all the routes you have created and allow you to see their full details including the interactive 3D profiles.

Head there NOW …

Here is one example ….

Screenshot 2016-05-05 09.22.52

really helps visualize routes and see potential problems (gradients)

GPS vs Smartphone (app)


from single track  …..

gps_test_points2

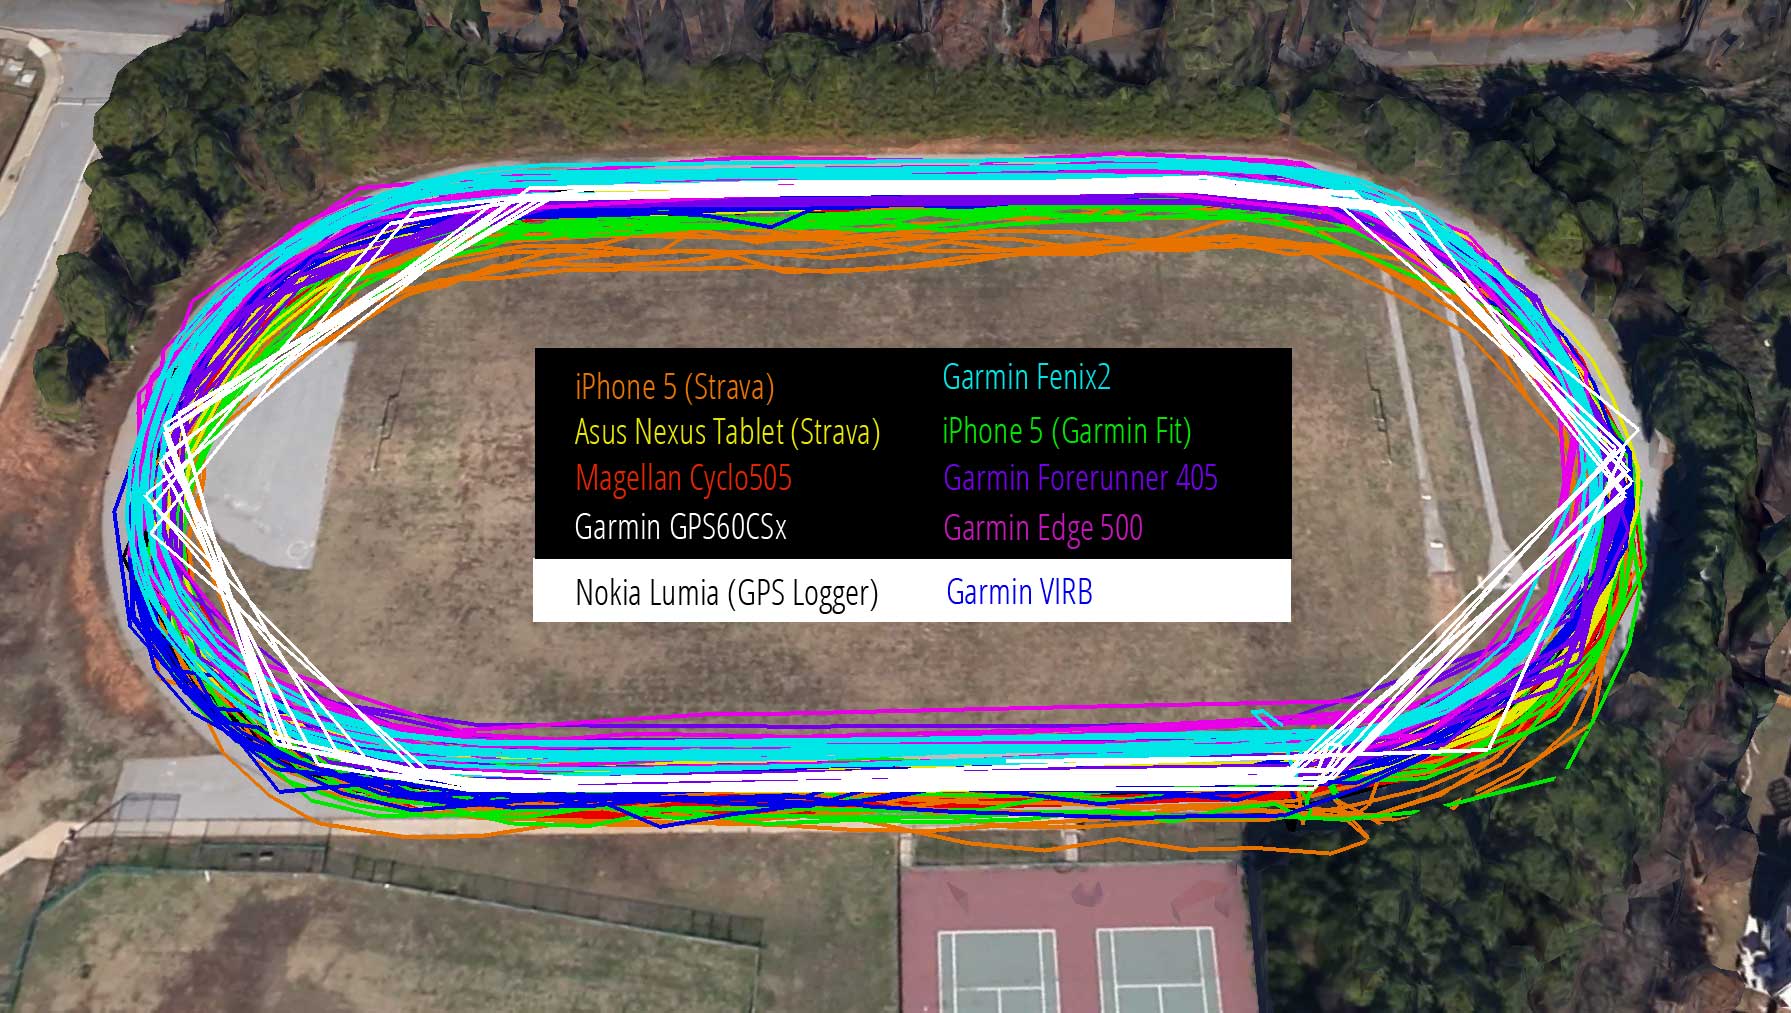
Over the summer there was an interesting discussion in the comments section of this article about the accuracy of dedicated GPS units from companies like Garmin compared to the GPS data collected via smartphones. I’ve personally been biking with a GPS since 2001 (13 years!) and my take was that neither is any more or less accurate than the other. Still, I was curious: was there any difference in accuracy between various types of GPS devices?

To find out, ckdake and I took 10 GPS devices–including 2 wristwatches, 2 bar-mounted units, 3 smartphones, 1 GPS-equipped helmet camera, 1 handheld device, and even a tablet–to a local quarter-mile track to see how each performed. We did our best to mount each unit according to its normal configuration; that is, wristwatches on a wrist, bar-mounted units on the bars, etc. All were rigged to a single rider (me!) and the test started and stopped at the same point on the track after riding 10 laps (2.5 miles). I stuck to the middle of lane 1 (thanks for the velodrome tip Chris!) and each GPS was started (but not moved) one at a time. We didn’t test timing on the devices since each unit is designed to sync time with the GPS satellites themselves, which meant we wouldn’t need to start and stop all devices at the same time.

Here are the results, ordered by distance accuracy.

Device Distance Error
iPhone 5 (Strava) 2.5019 0.08%
Asus Android Tablet (Strava) 2.5124 0.50%
Garmin Forerunner 405CX 2.5208 0.83%
Magellan Cyclo505 2.5239 0.96%
iPhone 5 (Garmin Fit) 2.5328 1.31%
Garmin Edge 500 2.5334 1.34%
Garmin Fenix2 2.5501 2.00%
Nokia Lumia (GPS Logger) 2.5542 2.17%
Garmin VIRB Elite 2.5795 3.18%
Garmin 60CSx 2.2529 -9.88%

Looking at the animated graphic at the top of this article, you can get a sense for another measure of accuracy–basically the tightness and “correctness” of the ride data. The actual route hugged the inside lane for each lap, though you can see some of the data veers toward the inside of the field and the edges in some cases (click here for an interactive plot). Subjectively, here’s how I would rank the accuracy based on the route plot:

Top 5: Asus Nexus Tablet (Strava), Nokia Lumia (GPS Logger), Garmin Fenix2, Magellan Cyclo505, and Garmin Forerunner 405.

Bottom 5: Garmin GPSMap60CSx, iPhone 5 (Strava), Garmin Edge 500, iPhone 5 (Garmin Fit), and Garmin VIRB Elite.

Interesting to note that the most accurate in terms of distance are not necessarily the most accurate at plotting route data. Keep this in mind when using GPS to map trails.

Accuracy

Overall, the error rate is pretty low–around 3% or less for all but one device. Still, only 4 out of 10 were within 1% of the actual distance. On average (if we throw out the Garmin 60CSx) each device is off by about 1.4%, which is probably a good number to assume whenever analyzing your own data.

Error Direction

Surprisingly, all but one of the devices over-reported the distance, which either means our track is slightly longer than we assumed or something else is going on. In my own experience I’ve noticed most GPS units report distance on the high side (for example, clocking 104 miles in a 100-mile race), and perhaps it’s by design to make consumers feel faster/stronger than they really are. Product engineers know the device isn’t completely accurate so why not just estimate everything on the high side to keep riders happy? :)

Another more serious possibility is that distance was added to each track during the time it took us to start and stop all the devices during our test (you can see this in the lower right corner on some of the plots above). Basically if you take pretty much any GPS, hit start, and set it on the ground, after a few minutes you’ll find that your GPS has logged several feet of distance without moving.  How is this possible?

GPS units never know exactly where you are located–they’re only accurate to within a few feet. So each time a GPS checks with the satellite, it’s calculating a slightly different position, even when you’re not moving.

Driving Factors

gps_test_overlay

Perhaps one of the biggest misconceptions about GPS accuracy is that it’s all about the chipset (like the SiRFstarIII) in a particular device. While it’s true that some GPS chips are more powerful and/or sensitive than others, there are many, many factors that can affect distance calculations.

But let’s stick with the idea that chipsets affect distance accuracy for a moment. Two of the top four GPS units in our distance accuracy test are regular old smartphones that determine location not just with GPS but also using wi-fi and cell tower signals to triangulate a position. And the Magellan Cyclo505–#4 above–is also wi-fi enabled, though we don’t know if it’s actually using wi-fi to improve location accuracy. Still, having more sensors available to calculate location isn’t a guarantee of accuracy–the Garmin Fit app on an iPhone 5 ended up middle of the pack in our distance test, and the Nokia Lumia smartphone ranked 8 out of 10.

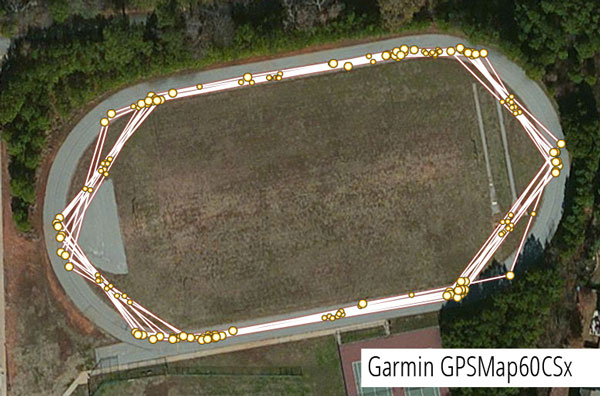
So what the heck happened to the Garmin GPSMap60CSx–it was off by nearly 10%?! There’s another factor at play here, and it’s known as polling frequency. Basically, GPS units check in with the satellite on a regular basis to get the user’s position and save that information, along with the time, to record your ride. Many apps and GPS units allow you to set the frequency yourself. For example, if you record your position once per second, you’ll get better data than if you record only once per minute. The tradeoff is more frequent polling will drain your battery faster and fill up your memory quicker.

garmin_gpsmap60_points

In the case of our track test, the GPSMap60CSx was set to record much less frequently than the other units, resulting in “cut off” corners that significantly shortened the distance (remember, a straight line is always the shortest distance between two points). Fortunately this is an easy fix and has nothing to do with the accuracy of the unit itself.

This is what more frequent polling looks like (specifically, 1 point per second):

garmin_fit_points

Some Garmin units (and perhaps units from other GPS manufacturers as well) have a “smart polling” option that doesn’t have a set polling frequency. Instead, the GPS records a point only if it’s not in a straight line with the point before it. A couple of the units we tested used this method which you can see below. In this test smart polling didn’t seem to affect accuracy but for a less-regular course (say, a twisting MTB trail) the GPS may have trouble keeping up with the rider’s constantly-changing vector.

garmin_fenix2_points

Software Manipulation

One final factor in our GPS distance accuracy test is the use of post-ride software processing. Basically if the GPS data is uploaded to a website (Strava, Garmin Connect, MapMyRide, etc.), chances are that the data will be manipulated. This is particularly true for elevation data (which we’ll discuss in a follow-up post), but I suspect even distances are being tweaked behind the scenes for some of the devices we tested.

In particular, it’s either incredibly lucky that the Strava iPhone app got within 0.1% of our target distance or that Strava is guessing (correctly) that our “workout” occurred on a quarter-mile track and is adjusting distances accordingly. Looking at the trace from the Strava iPhone app, it’s easily the messiest and least “tight” trace which, again, suggests it was either lucky or is making distance adjustments behind the scenes. The fact that the second-most accurate distance tracking also came from the Strava app but running on a low-powered Android tablet lends some credibility to the latter suggestion*.

Conclusions

This is by no means a definitive GPS distance accuracy test. In fact, if we conduct this test again (which we probably will at some point), my hypothesis is the ranking will be completely different. And aside from the track test, a test in an area with zero cell phone or wi-fi signals over a known distance (not a quarter-mile track) could help isolate the additional sensor effect and the software manipulation issues. Bottom line: if you’re choosing a GPS device or app for clocking your rides, don’t focus too much on accuracy… they’re all pretty good, but none are bulletproof.

* Being curious, I tested the theory that Strava is recognizing track workouts–and modifying them–by uploading raw data from one of the other devices used during the test. The result: no change in the distance. Still not definitive, but that theory is looking shaky.

Help the planners plan the new routes by using this new app


In what’s being claimed as the biggest ever cycling survey, London-based software company TravelAI has released an app that will track the routes cyclists use in order to provide data for authorities planning to build cycling facilities.

The iPhone app, WeCycle, aggregates the routes taken by all its users into a “community canvas” that its makers hope will inform the construction of new bike lanes and paths. An Android version is currently in beta testing.

Screenshot 2014-08-20 21.52.10

Unlike Strava, which recently announced it planned to sell the aggregated data from millions of bike rides to planning authorities, the data from WeCycle will be given away, as long as planners promise to act on it.

Andreas Zachariah, CEO of app maker TravelAI, told us that at a recent Future Cities project he’d uncovered a universal lack of data around walking and cycling. He said: “We will give the aggregated, anonymised data to [planning authorities] for free of charge in return for pledges to act upon.”

Zachariah and TravelAI’s belief is that transport authorities don’t know where people ride, and are therefore going to struggle to know how to spend the money that’s been allocated to providing cycling facilities.

He believes data from people actually riding is better than the alternatives.

He said: “What we want to avoid is transport planners deciding where cycle routes should be based on traffic counts from fixed automatic traffic counters or people standing at corners with clickers. It might explain some of the terrible routing, but sucks when so much money and goodwill is being (mis)spent.”

Two objections raised when Strava announced that it was aiming to provide data to transport planners are that the data only reflects a certain demographic and only tells you where people are already riding, not where they would ride if better facilities existed.

As one wag in the road.cc office put it: “The results will be skewed by all those iPhone users going to their local independent coffee shop.”

The planned Android version should deal with that, and Zachariah is sure the data will be useful to planners.

“Whether they are avoiding popular routes, joining the fracas or hostages to road diversions – we’re interested,” he said.

“There are people far more qualified than us to extract these insights and devise the appropriate strategy to bring about desired outcomes. But our firm belief is that without the data in the first place, these transport planners are hampered in their quest to be effective.”

Zachariah says he realises one of the problems is that UK commuter cyclists tend to be sporty males aged 20-50, a far cry from the spread of ages and equality of gender seen among riders in countries such as Denmark and the Netherlands.

“We worked with the European Space Agency for over a year out of the Netherlands and saw first hand how right the Dutch have it,” he told us. “It’s a continued source of inspiration and their amazing levels of participation across all classes and ages is just one of the pillars to their success.”

“We recognise there is going to be a bias so we ask [WeCycle users] to volunteer some demographic info. But we’ve gone to considerable lengths to make the appeal broader and consequently suspect that our data will contrast itself against that collected by other sporting/cycling apps.”

“We hope cyclists who might otherwise not feel compelled to install a cycling app and remember to start and stop it each time, will appreciate how effortless we make gathering cycling and commuting behaviours.”

WeCycle is  available for iPhone, from the iTunes store, but an Android version is in development.

As well as aggregating travel data, WeCycle provides you with a diary of your travel, and automatically detects how you’re getting around. In that regard, it’s a showcase for TravelAI’s main product, a set of developer tools for travel apps that can tell whether you’re walking, riding, on the train or sitting on the sofa.

It’s always on, but uses some clever algorithms so it doesn’t hammer your battery, TravelAI says.

It’s not a substitute for GPS-based ride logging apps such as Strava, but rather aims to provide a bit of useful information for you in return for you leaving it on so it can contribute your travel data to the general pool.

As reviewer pedro-o-o on iTunes puts it: “It works, which is quite magical – I’m still trying to figure out how it knows whether I’m on a train or tube or whatever. However, it can’t tell the difference between car and bike yet (you have to set that in settings). When they sort that out, it’ll be a solid 5*.”

best apps for training


With more and more people buying smartphones and the proliferation of training apps now available for them, it’s never been so easy to accurately keep track of your training. Gone are the days when you kept track of your training in a notepad, with careful handwritten notes. ROAD.CC

The latest generation of training apps makes it far easier to record and analyse your training, as well as setting goals and targets and reviewing previous performances. We’ve chosen 10 of the most popular apps so you can kick start 2013 with a digital thump.

And with smartphones now offering GPS maps and large colour screens, many cyclists are opting to use them in place of a dedicated cycle computer. Either mounted to the handlebars or safely stored in a jacket pocket, recording your ride on a smartphone is now common.

Garmin Fit

Garmin’s Fit app allows you to use your iPhone or Android smartphone as a training tool. It can be used for various sports, and one you’ve finished it uploads your session to Garmin Connect. It costs 69p but Connect itself is free to use. Once there you get all the important data and there’s useful functions like a calendar that totals your hours of riding each week, giving you an easy way of tracking your training progress.

Available for iPhone and Android.

Cyclemeter

This app functions as bike computer but can also store your route in Google maps, which can then be exported to social media networks like Twitter nad Facebook. A calendar makes it easy to see your recent rides at a glance and help to plan your next ride, and your favourite routes can be saved for future use.

www.abvio.com/cyclemeter/

The Athlete’s Diary

You can easily keep track of training rides with graphs of the total distance and time accumulated with this app. Information is clearly presented with the main screen a log showing some of your latest rides, so you can see at a glance how training has been going. You can also search your recorded rides too. Data is manually entered, but there’s an Autofill option for rapid entry. Only available for iPhone and costs $19.99.

www.stevenscreek.com

SportsTrackLive

This app lets you share and compare in a number of sports. As well as speed, distance, time, it works with compatible heart rate monitor straps and cadence modules. You can replay tracks on Google Maps, share with Facebook and Twitter friends, and export to the SportsTrack website. It only works with Android phones and costs £2.99.

www.sportstracklive.com

Training Peaks

A popular choice for cyclists, as it stems from Joe Friel’s TrainingBible series of books, Training Peaks is a very comprehensive training package that offers unlimited detail and control of your workout data. There’s training plans that can be bought and downloaded, taking the guesswork out of training, and there’s the novel Virtual Coach too. Works for Android, iPhone, iPod and iPad.

http://home.trainingpeaks.com

CoachMyRide

CoachMyRide, only available for the iPhone, lets you set goals and choose training sessions from a library of 105 included in the app. And for analysing sessions, Lionel Reynaurd is a professional cycling coach is available to offer feedback and share his knowledge. AS you progress in your training and you get fitter, the app easily adapts your training to suit.

www.coachmyride.com

Endomondo

Endomondo is a community based workout app that lets you challenge friends and analyse your training. A clean and clear display shows distance, speed and time when cycling, and you can customise what is show on the screen. Once you’ve done a ride you can upload to the website where you can create groups for your friends to share rides, and share through Facebook. With a Bluetooth heart rate strap you can add heart rate data to your training data. It’s free and works across all platforms.

www.endomondo.com

Kinetic

Described as the “Swiss army knife of GPS tracking and timing” Kinetic lets you organise your training sessions by activity or event. It can set goals and monitor your progress against a predicted finish time. Voice notifications chart your progress in real-time. Kinetic GPS Lite is free, while the full version is $3.99.

http://kineticgps.com/

Cychosis

Rather than automatically logging your ride data, which is fine if you want to use your smartphone on the bike, Cychosis differs by requiring you to manually enter data from each ride. So you can leave your phone safely at home or not have the battery drained in 5 minutes by the constant GPS usage, and enter ride information form your cycle computer when you’ve finished your ride. And if you love your spreadsheets, you can export ride data to your computer.

www.cychosis.com

Strava

One of the most popular apps is Strava, because of its unique feature of letting you compared times on ‘segments’ of road. Users can create segments themselves, and any person that has ridden along this segment is added to a leaderboard. So you can see who is fastest on your favourite climb for example. With a community revolving around this feature, it adds a competitive element to training on your own. A suite of power and heart rate analysis tools makes it a good option for those who want to take their training seriously. Available for iPhone and Android.

Strava Addict – here are some sites that let you get more


The Multiple Ride Mapper

This great app / (website) pulls in all of the rides and runs you’ve ever logged on Strava and displays them on one map. Simply copy and paste your athlete number into the box and be amazed as it pulls in every ride and maps it. If you are struggling to find your athlete number then hit profile in strava and it will show a number in the address bar – this is you.

The website uses opaque lines so if you’ve ridden or run certain roads many times, you will end up with a darker line, whereas roads you’ve only ridden once will be more pale. The map is clickable, and the list on the left hand side takes you back to the ride screen on strava.com if you wony to see an indication of frequency then set opaqueness down to see all your routes clearly.

20121015-212025.jpg

Here is a map of some of my rides over the last few months – some road, a few mtb and one or two commutes or runs.

KOM Notifier Service

Created by the same author as the multiple ride mapper above, Jonathan O Keefe, the KOM notifier service will give you detailed notifications about any changes to your KOMs, or indeed any changes in the top 10 positions.
20121015-214123.jpg
Segment details

Yet another brilliant bit of coding from Jonathan again, Segment Details can be accessed separately as a standalone thing, but it is also linked from the Strava KOM Notifier Service, above.

This one is really useful for tracking the history of a segment – who’s been KOM in the past, when did so and so take it, how many people have ridden it, what’s the average time taken etc.

RaceShape.com

RaceShape is essentially about analysing the differences between people riding a segment. Say you lost your KOM or if running your CR to someone – you can use this tool to analyse where they were quicker, and so help you to develop your strategy. It works by analysing how the gap changes between two riders, and works with segment data from Strava or Ride with GPS.

Here is a screengrab of a flat canal path section that I took my road bike on – it analyses your time over distance and although I am 3rd on this section I can see that in the first wee bit of the trail where I was chatting to someone with a flat tyre – suddenly that is the 40 sec gone. Although slower than no 1 and possibly no 2 it was close.
20121015-212617.jpg

Using no 2 as a baseline you can see where I level out and we are quite matched. By comparison my friend Keith did the route and you can see the slope of his pace and where I eventually catch up and pass. So now that I know this is a section I might just burn it along here (although not on a weekend when there are so many dog walkers perhaps.

Veloviewer

It gives you more stats to play with and get twitchy about than you might ever want. Dig around and you’ll discover a great new way to explore the segments you’ve done, and get ideas about which ones you want to revisit.

Tip: Click the table column headings to sort on that column. You can sort this on average speeds or overall length or steepness and so on.

You’ll discover segments you’ve already done, but never realised were there, prompting you to think about targeting them for a serious effort.

Here is a mtb climb once again using Michael D as the base line and my pal Stuart who is notionally behind me. Interesting to see I started fast but burnt out a bit on the muddy section with the big puddle. I could pretend it may have been dry on the days the others did it or it could just be that I was tired. Stuart and I swap the lead a lot towards the end. Does really let you see where others or quick and where you are slow.

20121015-212809.jpg

How did you sleep last night


Been thinking I have not been sleeping well lately – not helped by the fact I came in from my 40km ride last night at 9pm. Always takes me a bit to switch off.
Have a app called sleep cycle which monitors your sleep pattern by picking up how much movement you make during the night to determine your moment of deep sleep. I woke at 3:30 for a drink of water then up at 6:50.
Monitoring over a few days gives you quite an insight into what you do at night and how that affects training.

Software for your Heart Rate Monitor and GPS


To some of us geeky MAMILS (middle aged men in Lycra), one of the biggest pleasures, next to the ride or run itself, is quantifying the vast amount of data available to us about our performance.  The prevalence of GPS based and downloadable cycling computers, combined with various websites and programs have made it possible to catalog, view and analyze mountains of data; metrics from average pace to peak wattage vs. peak heart rate are now at your fingertips.  Here’s a quick overview of a couple of the more common sites and programs out there.

 STRAVA


my new favourite after a while playing with Endo … (see next)

Strava.com is the relative new kid on the block in terms of ride analysis.  Offering both free and frankly too expensive subscription services ($6 per month or $59 per year) will allow riders to directly upload rides from their GPS devices and track their performance.  Displaying a GPS track of the route you rode, along with an elevation profile and metrics such as distance, elevation gain, moving time, speed (max and average), average speed, average cadence and average power, you get a mass of information to sift through and analyse.

The coolest thing about Strava and it is something that Endomondo also does is social connection ….  You can link Strava to your Facebook page and twitter account and you can even challenge friends (or strangers for that matter) to competitions.  Strava has a unique feature that allows you to designate segments of your ride and run (climbs, TTs, crazy descents) that you can measure against every other person on Strava that has covered that route (or just a section) before and uploaded their ride.  It’s an excellent idea that promotes competition and growth amongst different riders all riding in the same area.

Here is a section of the Arran ride that someone has made into sections … woo hoo I did well without even knowing it.

For example, imagine your club has a friendly “climbing competition” up a particularly long, steep, or otherwise nasty climb.  Anyone who is a member of Strava who uploads a ride containing that climb will be ranked based upon speed, power, time and VAM (Vertical Ascent Meters) along with everyone else who has ridden that climb.  The best part of the whole thing is that once the climb is designated on Strava, the site software automatically finds that segment of your ride and analyzes it, compares it to everyone else, and posts it in ranking of fastest to slowest.  It’s an excellent tool to use to compare both your form compared to others around you, and to chart your own progress by comparing to your previous attempts.

PROS: Great community based concepts.  ”Segments” option for competing with your friends.  Excellent data presentation and layout. Standalone free iPhone app if you don’t have a dedicated gps hrm

CONS: Pay site is yet another expense (free site only 5 rides/month allowance)

ENDOMONDO

My old favourite social exercise site – allowed you to see your friends workouts and comment on them. Again it allows analysis of the ride or run and also keep a note of your PB’s.

The social interaction may be slightly better on Endo although I prefer the slightly better analysis on Strava …. Again there is a dedicated app for iPhone so you can use that on commutes when your gps or hem is at home. Both these sites are better with Garmin products and that is more to do with the disinterest on the part of Polar and suunto more than the development of either of these two platforms. At the moment I import the gpx track from file although this loses the hrm info from the exercise. At the moment you can import the average and max readings into the endo workout but it is not a true graph.

Alternatives for Me

Movescount for Suunto users

Good analysis but lacking social connections as there is no app and your friends can’t compare to you.

Polar Personal Trainer for Polar HRM users

Better analysis but even less social connections.

e-paper watch for running, cycling and more


this watch looks very cool – not sure if it will record but might be a great interface for an endomondo or running app on my iPhone ….

THEIR SITE HERE

Customize Your Perfect Watch. It’s as Easy as Downloading an App.

Pebble is the first watch built for the 21st century. It’s infinitely customizable, with beautiful downloadable watchfaces and useful internet-connected apps. Pebble connects to iPhone and Android smartphones using Bluetooth, alerting you with a silent vibration to incoming calls, emails and messages. While designing Pebble, we strove to create a minimalist yet fashionable product that seamlessly blends into everyday life.

CUSTOMIZE WITH APPS

Apps bring Pebble to life. We’re building some amazing apps for Pebble. Cyclists can use Pebble as a bike computer, accessing the GPS on your smartphone to display speed, distance and pace data. Runners get a similar set of data displayed on their wrist. Use the music control app to play, pause or skip tracks on your phone with the touch of a button. If you’re a golfer, feel free to bring Pebble onto the course. We’re working with Freecaddie to create a great golf rangefinder app for Pebble that works on over 25,000 courses world-wide. Instead of using your phone, view your current distance to the green right on your wrist. These apps will be the first, with more in the works!

CUSTOMIZE WITH WATCHFACES

Pebble can change instantly, thanks to its brilliant, outdoor-readable electronic-paper (e-paper) display. We’ve designed tons of watchfaces already, with more coming every day. Choose your favourite watchfaces using Pebble’s iPhone or Android app. Then as the day progresses, effortlessly switch to the one that matches your mood, activity or outfit.

CUSTOMIZE WITH NOTIFICATIONS

If you need to stay on top of things, Pebble can help with vibrating notifications, messages and alerts. Dismiss a notification with a shake of your wrist. Don’t worry, it’s easy to disable all notifications.

  • Incoming Caller ID
  • Email (Gmail or any IMAP email account)
  • Calendar Alerts
  • Facebook Messages
  • Twitter
  • Weather Alerts
  • Silent vibrating alarm and timer

Android users can also receive Text Messages (SMS) on their Pebble. Unfortunately iPhone does not expose this data. Have any suggestions for other notification types? Leave us a message in the comments!

iPhone iPad app to make your sailing better


Best sailing tool might not be a gps or amazing fitness – it may be post race analysis to see where you are poorest … tactics. This is fascinating for sailors wanting to improve. I was watching a series the other night on my my iPad and it was really interesting to see why the goog always rise to the top. Was watching on particular race series and enjoyed one were a guy who was pretty good had a bad second race start … was interesting to see how he tacked his way out of trouble on the first leg. See their home page here

BLURB

We’d all like to improve our sailing, but often it’s hard to really know what to improve. On a typical weekend, the good guys are quickly in front and there is no way to tell what they are doing right and you wrong.

Sometimes a race is lost on a “bad leg”, but what actually happened and what went exactly went wrong? Often we never find out. How do we identify our current weakest point of sailing that we should be attending to first? What is needed is information; hard facts, that are often not available to you on the race course.

With the availability of inexpensive GPS tracking devices, such as the QStarz BT-Q1000X,  it’s now easy to record a boat’s track around the course. And with TackTracker, you can play your GPS tracks and watch the race again, as it happened or navigate tack by tack.

But TackTracker is much more than just a player. It is a race analyser, and can give us leg by leg information on how far we have sailed, how fast we were going, and how high we pointed on both port and starboard tack.TackTracker can even deduce the ambient wind direction, and indicate which tack a boat is on at any time, and whether it was close hauled, reaching or running!

Its fun to play your track around the course, and there are plenty of things to learn. The real value is attained when a number of sailors get together and share their tracks with each other. Then you can ascertain who travelled the shortest distance on the windward leg, who was sailing fastest, and who highest. At moments in the race where you may have fallen back, you can see what you were doing in relation to the other boats you were competing with.


A Complete GPS Solution

TackTracker is designed to deliver a complete solution, streamlining and automating the entire process from uploading tracks into the software, archiving and managing tracks, to viewing and playing tracks.

The track browser maintains a library of your tracks organised by date, so you can easily find tracks from past races.  You can select individual tracks, or an event (race) which may contain multiple tracks. As each track or event is selected, it is displayed in the track player.

The track player has a group of navigation buttons at the bottom, which you can use to drive your boat around the course. You can also press “Play” and sit back and watch. Then speed up and slow down the action as required.

The track player lets you pan and zoom with the mouse, or you can turn on “auto zoom” to have the player automatically track the race boats. You can also drag the mouse to create a distance and bearing meter allowing you to assess the separation between boats at any point.

Races are defined in the “Event Editor”, where you set the start time and lay the course marks. This is all done graphically, allowing you to define the course in a matter of minutes. Once the course is defined, all participating tracks are analysed and all race legs computed. The Legs table gives you a summary of all the key statistics for each leg for each competitor.


You can sort the table by any column to compare results for any leg or competitor. Powerful!

TackTracker also has a great range of interactive charts that provide additional insight into your boat’s performance. The speed chart shows boat speed over the course of the current leg, whilst the deviation chart shows how high or low you are sailing to the true course. Together, these charts are an effective visual summary of your sailing efficiency.

The vertical bar indicates your current location. As your boats progress through the leg, the bar moves to the right. Alternatively, you can drag the bar with the mouse, and the boats will follow. (My daughter says this is really cool!)

There’s lots more to TackTracker, but this will serve as a quick introduction.

To learn more, the best thing you can do is download and install the free race player from the Download page. You can watch and interact with races available online that have been recorded at regattas for a range of classes. You can also read the User Guide, available from here.

I hope you have fun using TackTracker and that it helps you improve your sailing.


For a limited time, the TackTracker Player App is a FREE download from the Apple App Store.  Go to the App Store

New! You can now get a TrackTracker Player for your iPhone and iPad. You can browse the online races database and play and review all the racing from the convenience of your handheld device, wherever you are.  You’ll be impressed by the full-featured player with multi-touch panning and zooming and all the familiar graphics from the PC players. Includes a full regatta browser, competitor selection, and leg by leg stats and charts. See stats and charts for any two competitors side by side.

This new player is the first manifestation of a significant investment TackTracker is making in the Apple platform. We now have all the core software running natively in Apple’s application frameworks. Stay tuned for more to come.

iPhone Screen Shots


Searchable Regatta Index. Tap any Regatta to see the Regatta detail, including a photo and list of races.
Player: Note you can tap in the player to hide the top navigation bar.


 iPad Screen Shot

The iPad is a wonderful medium for TackTracker, with plenty of screen real estate for a compelling replay wherever you are.


Pace Calculator app by Runners ally


Found this last night a really handy app for pace calculation as well as being a predictor for race times over different distances. I based this on my last race and must say it predicts a 3h00 marathon time which is frankly very flattering. But although it is just a guide it also is quite motivational and makes me want to enter and train for one.
If I do enter a marathon my only desire is to beat my brother-in-law’s time which was 3H31 and he is 10 years younger than me.

I have done a half marathon before and did a 1H42 with no training and crappy running gear.

Will have to check my work schedule and see what I can do.

GPS Running and Biking apps for the iPhone a recap


screen grab

I did a brief review of apps a while back – thought it was time that I reviewed the ones that still stay on my iPhone …

MOTION X Pro


I paid for this app – it is a great sub for a dedicated gps unit. It is very quick to pick up signals and lock on to the satellite signal. If you are buying an app as a dedicated gps then this is the one. For purely cycling or running there may be better.

CYCLEMETER (bike App)

See here

THE BIKE

A more basic gps application. Screen comes up horizontal layout which is a better use of space on the screen. The top shows duration – centre shows speed with odometer below. On the left there is an average speed display and a maximum speed display. On the right is a trip display and a large  Start button which once pressed turns into a STOP button. Ease of Use is the primary benefit. Tracks can be saved and also uploaded to everytrail

TrackThing

vitals

A good gps unit equally good for biking or running. I have done 2 screengrabs. It is a vertical display on black background that is easy to read.

Vitals shows Speed and Distance and Duration. Good for cycling.

Stats Screen

Stats shows avg pace / avg speed and odometer

Velotrac

Downloaded for trial. Not one I will describe and recommend here.

GPSies

Another good vertical display. Again more for bikes. Display shows Elapsed Time / Distance / Average Speed and Current Speed. Bottom half of screen is map display. Again this can be uploaded to GPSies where there are tools and tracks to share. While app is quite basic the website is versatile.

Runkeeper

map screen

As it says on the app – running is in the name itself. Two screen displays – a read out of time avg pace and calories at the top and a map below.

split screen

Second screen shows /min splits. I believe in the pro version you can change this to /km splits. A good running app which will serve most runners well.

Runmonster


RunMonster


A really nice running app – I like the display and the readouts on this app – think it is the nicest app for running.

Display shows Distance / Time / Pace / Calories

Below it shows splits showing altitude climbed and /km splits. You can them email your route – it attaches a gpx file and also allows you to see the route in Google Earth.

WalkJogRun


WalkJogRun


Not so much a gps tracker as a track finder – finding routes in an area that you are visiting or living. Can display in vertical or horizontal format.