Garmin 920XT and running Dynamics


Got new life insurance and the company i am with offers 50% off on garmin products and as I am such a gadget head i decided to buy the 920XT which is also useful for swimming besides my normal running and cycling.

Screenshot 2016-04-17 15.52.59

The watch itself maps other data that i was not familiar with so popped out this morning on a run just over 10km to explore what the running dynamics mean.

Screenshot 2016-04-17 15.39.25

Running dynamics give a summary

Screenshot 2016-04-17 15.46.35

Cadence i know is stride rate – quicker chi type running has always been my thing – i am not a long heavy impact strider … In general, more experienced runners tend to have higher cadence. An often-cited target for running cadence is 180 steps/min. So i am bang on target for this run.


First off is Vertical Oscillation

I was feeling stiff at first but loosened up after a km of running – this is where the data goes into blue – there are green spikes in sync with the downhill sections after that …

The colors show how your ground contact time compares to other runners. The color zones are based on percentiles.

Color Zone Percentile in Zone Ground Contact Time Range
Purple > 95 < 218 ms
Blue 70 – 95 218-248 ms
Green 30 – 69 249 – 277 ms
Orange 5 – 29 278 – 308 ms
Red < 5 > 308 ms

Garmin has researched many runners of all different levels. In general, more experienced runners tend to have shorter ground contact times. Elite runners often have ground contact times of less than 200 ms. Virtually all experienced runners studied have ground contact times of less than 300 ms. Higher cadence and faster paces are both associated with shorter ground contact times. Many running coaches believe that a short ground contact time is characteristic of a more economical running form. However, at a set cadence, decrease of ground contact time usually increases vertical oscillation.

Introducing the young


As much as I love the outdoors and exercise I am always careful on pushing this love onto my two youngest girls.

This week the girls have been on a sort of half term break of school for Monday-Wednesday. We decided with an amazing forecast to climb the Cobbler …

The Cobbler (Scottish Gaelic: Beinn Artair) is a mountain of 884 metres (2,900 ft) height located near the head of Loch Long in Scotland. Although only a Corbett, it is “one of the most impressive summits in the Southern Highlands”,and is also the most important site for rock climbing in the Southern Highlands. Many maps include the name Ben Arthur(an anglicisation of the Gaelic), but the name The Cobbler is more widely used.


cobbler-1
girls and grandad


The walk starts from near sea level and goes up steeply through a wood section and continues from there, following a burn known as the Allt a’ Bhalachain. this section is open with a beautiful vista ahead up towards the Cobbler.

cobbler-6

From here the path bypasses the Narnain Boulders, steepening at around 600 metres (2,000 ft). The path splits and you can go left and straight up the face between the two peaks but this was heavily iced and we had no crampons or sticks or even axes. We followed the path around and ascended from the rear.

Screenshot 2016-02-18 10.54.33

The back was still very snowy and it meant an ascent where we had to kick the steps into the snow. the youngest (9) was keen to be first but after 10min let me do the steps until we were 20feet from the top and then took the lead again.

cobbler-18

We made the top – with photographic proof

cobbler-21

whilst sister (11) and grandad were still ascending

cobbler-16

it was so unseasonaly hot with nary a breath of wind. So mild in fact we had lunch at the top.

cobbler-23

and then down to the pass again before the descent.

cobbler-15

And home to a fire ….. asked the girls the next day whether their legs were sore at all.

NO

What more could you want.

cobbler-40


Spy bike tracker – a great idea for your 6k princess


The latest weapon in the war against bike thieves is the SpyBike GPS tracker – a device the size of a tube of Smarties that fits inside a bicycle’s steering column and can track its whereabouts anywhere in the world.

The £83 SpyBike allows a cyclist to track the location of their bicycle anywhere in the world should it be stolen. The SpyLamp nestles beneath an innocuous-looking headset cap beneath which hides GPS technology, the workings from a pay-as-you-go mobile phone and a motion sensor to allow the bicycle owner to track the whereabouts of their bike via a website using Google Maps.

Once armed, any movement of the bicycle will prompt the tracker to send a text to its owner and begin to send details of its location, which can be tracked online.

Car tracker systems that emit a VHFsignal, which can be picked up by receivers fitted to police cars have been available for years. The technology is proven, but expensive; the cost of buying the unit and having it installed can run to hundreds of pounds and there is also a subscription to pay. The Spybike is cheaper to buy and costs pennies to run. Using a typical pay-as-you-go SIM card, each position upload costs approximately GBP 0.0006p.
=”caps”>ETA
, which is currently testing the Spybike tracker, says: “Cyclists and insurers alike have been waiting for a product like this for years – unlike any existing security device it puts the bike thief on the back foot.”

Cycling and the wind – there is a cure


Don’t Go – this weekend the forecast was pretty mean and the cyclists I spoke to afterwards had scary tails – from the front 3 in a group being blown sideways in the road narrowly missing a car to a solo friends 30km battle into the 40know headwind ….

Screenshot 2015-03-11 14.08.53

I went kitesurfing instead and had a whale of a time. sure it is winter and cold and i hate kitesurfing in full gimp kit (hoodie gloves and boots as well) and after 1 hour you have to take a break but still what a great day

Screenshot 2015-03-11 14.13.14

what is interesting is putting the details into veloviewer and analysing speed there in the data sections – most of my time is spent in the 28kmh-30kmh (16knots in old nautical money) zone which when you work out that involves jumping and riding waves is pretty fast. and a good low cardio fat burn heart rate of 120-130bpm

Screenshot 2015-03-11 13.59.53
Zones in the veloviewer website

Getting ready for bikepacking


i have been planning a route for a while – off road with a night in a bothy shelter up in the Cairngorms …. so was all prepared to pack and then take OS maps. But I recently bought an eTrex 30 from Garmin and a SD card with the OS maps of the UK on it. The idea is that this is my primary nav aid (although will have compass, OS map and another gps with me)

planning a trip and putting in waypoints, bothies and other bits ...
planning a trip and putting in waypoints, bothies and other bits …

So starting using Basecamp as well – this has improved a ton since I last looked at it years ago – it helps having the etrex connected or the SD card plugged into the computer because then you can use the OS maps. If only basecamp let you use google or bing or satellite pictures as sometime you can see a trail that is not marked …..

Will report back on the eTrex once i have used in anger – all I can say so far is that the bike mount is not the most sturdy …

reblog* After a Bike Packing GPS the Garmin eTrex 30


I need a gps which has batteries so no need to try have charging ability but that also can take maps ….

this review from here .

After well known eTrex Vista HCx Garmin has produced the new generation of GPS units including eTrex 30. Most of them have used touch screen technology. New eTrex xx and 62 series are the exceptions. In muddy and dusty conditions a touch screen isn’t my choice. Below is the first look – review of eTrex 30.

mtb

The new eTrex 30 unit like Vista HCx is equipped with the key control buttons and thumb stick. On eTrex 30 the thumb stick is placed on the right side. The main advantages of eTrex 30 are included functions for basic fitness parameters and custom maps & BirdsEye images (kmz & jnx raster maps). eTrex 30 is GLONASS ready and can operate in GPS + GLONASS mode. The provided user manual doesn’t mention many important functions and details like handling of jnx&kmz maps, tracklog limitations, fitness parameters recording etc and in this review I would like to present most of them. The official Garmin data & specification are available here.


1. What is in the box?

in_the_box

eTrex 30 GPS unit, USB cable, Quick start manual.


2. eTrex 30 body is made by well and precise designed plastic material.

housing_1

3 keys (zoom in/out & menu) are placed on the left side and 2 keys (back and power on/light) on the right side. Thumb stick is placed on the front. It is a miniature joystick helping us to navigate and select the menue items. Furthermore, thumb stick can select and mark any point on the map much more precisely than the finger on the units supplied with the touch screen. On the old Vista HCx the joystick is placed on the left side. I am right handed and I prefer to handle with GPS unit by my left hand. In this case my right hand is free for the moving and doing some other important tasks.

At the back side of eTrex 30 body there are battery and mini USB connector covers. The battery cover is fixed by locking ring and by plastic slot at the opposite side.

housing_2

In comparison with the old eTrex, the additional plastic slot and the shape of the cover improve the rigidity of the cover during vibrations special in the case of MTB rides. The next good news is that Garmin no longer uses the laminated rubber on the sidewalls of the unit. The pulled back laminated rubber made a lot of troubles on old eTrex series.

New eTrex 30 uses the same bike holder as Oregon/Dakota series.

bike_holder

This holder is very simple and sturdy. Can be easy fixed on any position on the handlebar. This is the next improvement over old eTrex series.

Based on my experience with the old units I mounted the additional tubing to protect my eTrex 30. A piece of tubing preventsslipping on smooth surfaces and protects against impacts (see more details in comments section).

tubing_protection

Mini USB port is covered by rubber keeping IPX7 waterproof standard of the complete housing.

usb_connector

It is important to know that eTrex 30 uses basic USB 1.1 standard only. High speed USB 2.0 is missing. It’s a pain to upload big files of the maps on the unit. USB 1.1 slows down the process when you experiment with some custom designed maps. For example to upload the map of 200MB it takes about 2-3 minutes. The option is to remove the micro SD card but in this case you have to remove the batteries too.

Micro SD card slot is placed below 2 standard  AA batteries.

back

NiMh, Alkaline or Lithium types batteries can be loaded. Each type should be confirmed in Setup – System menu.


3. As far as I know eTrex 30 is the first Garmin unit GLONASS ready.

gps_glonass

eTrex 30 can work in 2 modes: GPS and GPS + GLONASS. However, GLONASS ready unit helps to Garmin to sell new eTrex 30 in Russia without additional taxes.


4. In addition to vector maps eTrex 30 can display 2 types of raster maps: jnx maps and kmz custom maps. More details about these types of raster maps are available here

jnx_kmz_setup

Depending of the map scale factor and active zoom each uploaded map can be displayed or not. The scrolling & zooming speed of vector maps on eTrex 30 and eTrex Vista HCx is almost the same. The scrolling & zooming speed of raster maps (jnx & kmz) on eTrex 30 is much slower than on Oregon 550. Despite low resolution of the screen the processing power of eTrex 30 is not enough for fast redraw. In this respect Oregon 550 is much faster and using the same vector map I didn’t see any improvement over Vista HCx.

5. eTrex 30 can display heart rate and cadence.

map_screen

Like on Vista HCx on the map screen maximum 4 data fields can be set. During active tracklog both heart rate and cadence are recorded in gpx file. On 19-Apr-2012 I tested Garmin Connect and eTrex 30. Garmin Connect can detect eTrex 30. The data from the stored gpx track file can be exported to Garmin Connect via manual upload only. After that Garmin Connect can display the route on the map, speed, elevation, heart rate & cadence.


cadence_hr_belt_1

The optional cadence/speed sensor and heart rate belt are on the above image. The heart rate belt senzor is the old one, coming from my Oregon 550. I guess this type of heart rate senzor is not available any more. Both senzors are supplied with standard CR2032 battery. The battery can be easy replaced. My cadence/speed sensor setup uses cadence function only. Speed option is not supported by eTrex 30. On eTrex 30 speed value is recorded/calculated from GPS tracklog. I fixed the magnet & cadence sensor with tape too. This is the backup in the case when plastic strip brakes. The pairing of eTrex 30 and sensors is simple and fast. The cadence sensor can be easy mounted on different type of bikes. It’s very sensitive and minimum distance of magnet isn’t an issue.


profile_mtb_1

eTrex 30 supports different profiles for different activities. In each profile you can define different screens with different type of fields. The setup items are stored in each profile too. Above are typical map and trip screen configured for MTB activity. The profile is stored under MTB name.


6. eTrex 30 is equipped with sun readable screen. Below are the images of Oregon 550 (new version with better readability of the screen), eTrex Vista HCx and eTrex 30 at 0% & 50% backlight during cloudy day. Compare the size of the housing, size & readability of the screen. The scale factor is 120m on all units.

backlight_0

backlight_50

The readability of the screen under the sun:

eTrex 30, Vista HCx & Oregon 550 readability under sun

Good to know that the readability of eTrex 30 under the sun is very good. Click on the image to get the high resolution image.


7. The roughly current consumption measured with ampermeter.

power_consumtion

Roughly current consumption (mA) 0% backlight 50% backlight 100% backlight scrolling the map adds
eTrex 30 90 120 190 + 30 mA (raster map)
eTrex Vista HCx 90 135 190 + 10 mA (vector map)
Oregon 550 (new version) 130 165 230 + 110 mA (raster map)

eTrex 30 power consumption is almost the same like Vista HCx. Due to more processor power, scrolling the map adds more power consumption. Preliminary, Oregon 550 zooming & scrolling speed is almost x2 than eTrex 30.


8. eTrex 30 is equipped with 3 axis electronic compass like Oregon 550. The old eTrex Vista HCx has 2 axis compass. New 3 axis compass of eTrex 30 is slightly more responsive to direction changes than on eTrex Vista HCx.

After the calibration I compared 3 units with classic compass.

compass

The approx error of the azimuth in degrees is:

eTrex 30: 0°

eTrex Vista HCx: 1°

Oregon 550: 1,5°

Probably this is related to the compass chip and the error could be different from unit to unit on the same model……


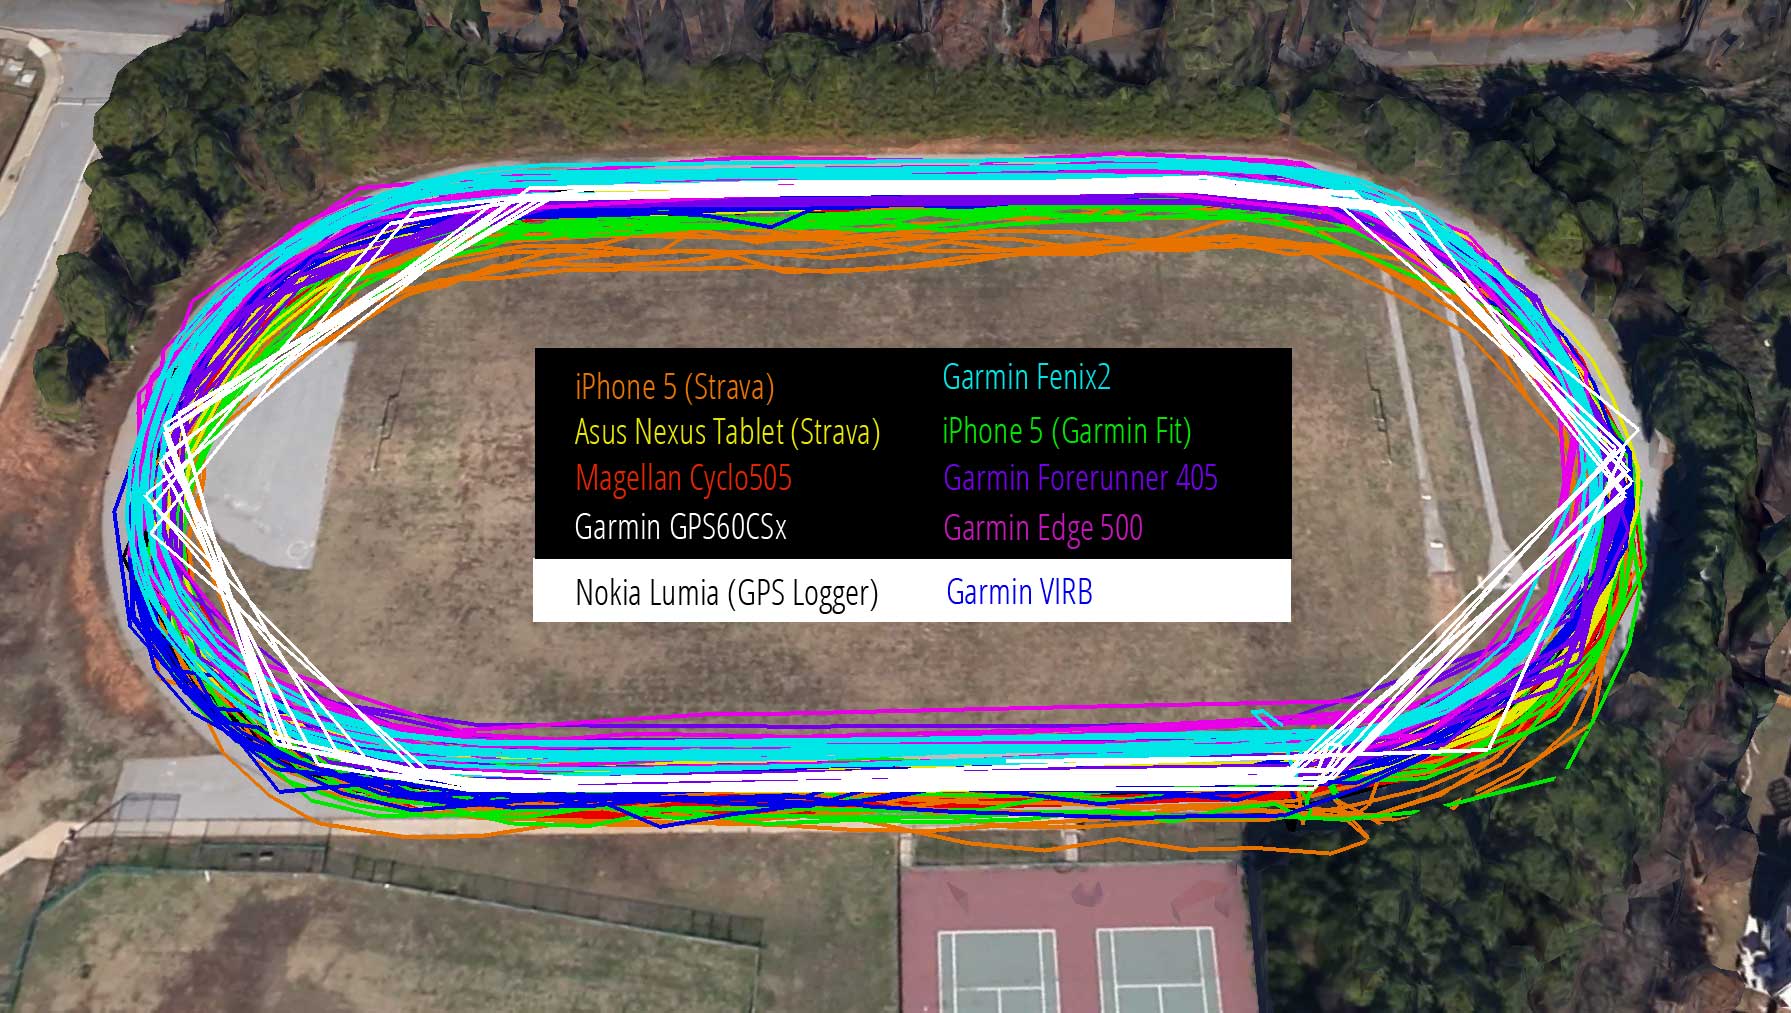
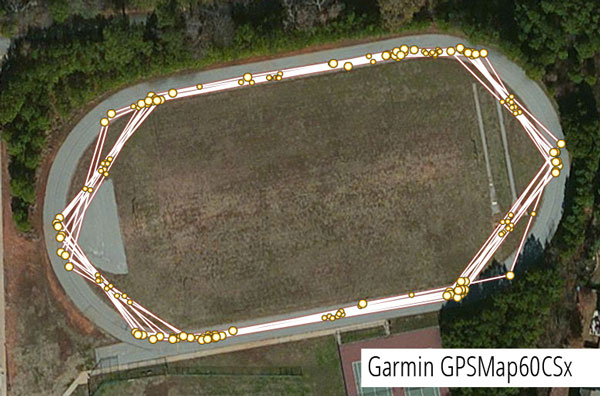
9. 2D precision test

measure_place_2

Above is the image of the measuring place. The distance between Vista HCx & eTrex 30 and eTrex 30 & Oregon 550 is 4 meters under the opened sky. The direction of the placement is from south to north and the place is at UTM 33 (N) zone. I did 10 minutes GPS tracklog and 10 minutes waypoint averaging tests. Please note this is not the test of accuracy! The test were performed with firmware version 2.40. The data were imported into my GIS program and the results of precision are on below map:

karta_mjernih_rezultata2_low

Click on above image to get the high resolution image of the precision test. There is no benefit in precision from GPS+GLONASS and WAAS/EGNOS modes on eTrex30 in my zone. During the precision test Vista HCx outperformed eTrex 30 & Oregon 550. However, eTrex 30 GPS+GLONASS mode can help to speed up cold start and to increase the number of available satellites on the places with limited clear sky.


10. Elevation

The altimeter of eTrex 30 can work in automatic or manual mode. In automatic mode altimeter/barometer is calibrated with GPS elevation data. The details about automatic calibration are not available in the operating manual. After several runs and comparison of recorded elevation data  I can confirm that my eTrex 30 has less spikes than Oregon 550 and even less than Vista HCx. The main issue is that eTrex 30 calculates a fake total ascent value. I did the test with firmwares 2.40, 2.50 & 2.70. The total ascent value is 5-12% more than on Vista HCx. Hope Garmin will resolve the issue in the next firmware upgrade. The good point is that total ascent value can be displayed even on the trip screen. This option is not available on Vista HCx and Oregon 550. I tested total ascent value with firmware 2.80 and the issue of fake total ascent calculation is resolved. I removed the issue from (-) list.

12. My conclusion

Like some other Garmin models eTrex 30 includes some important characteristics for outdoor activities: standard AA batteries, IP protection, good outdoor readability of the screen, altimeter with barometer option etc. eTrex 30 offers many standard navigation functions. You can use them with vector routable and non routable vector & raster maps. Geocaches support is available too. Due to the size of the unit and available functions, eTrex 30 could be very popular for hiking and MTB.

During last few months I have compared Garmin eTrex 30 with Vista HCx & Oregon 550. Just few (+) and (-) are below:

(+) raster maps compatible (not available on Vista HCx),

(+) ready for heart rate & cadence option (not available on Vista HCx),

(+) 3 axis compass (2 axis only on Vista HCx),

(+) improved body materials and much better bike holder (better than on Vista HCx),

(+) fast cold start time (better than on Vista HCx),

(+) instead touch screen eTrex 30 is equipped with key command buttons and a thumb stick. In muddy & dusty conditions and with glows on my hands I prefer this setup. The same is on Vista HCx,

(+) total ascent field is available on trip & map screen (on Oregon 550 & Vista HCx total ascent is available on elevation profile screen only). Total ascent value is direct proportional to fatigue so this value is very important parameter for long rides or long hiking routes,

(+) different profiles can be set like on Oregon 550 (not available on Vista HCx),

(+) huge internal memory of 1.7GB can be extended with external micro SD card,

(-) very bad operating manual (nothing new from Garmin),

(-) slow redraws (zooming & scrolling) of the maps on the screen (Oregon 550 is much faster, no any improvement over Vista HCx, see above video at point 11),

(-) for precision no benefit from GPS+GLONASS mode (at least with firmware 2.40 and in my UTM 33N zone),

(-) slow USB 1.1,

GPS vs Smartphone (app)


from single track  …..

gps_test_points2

Over the summer there was an interesting discussion in the comments section of this article about the accuracy of dedicated GPS units from companies like Garmin compared to the GPS data collected via smartphones. I’ve personally been biking with a GPS since 2001 (13 years!) and my take was that neither is any more or less accurate than the other. Still, I was curious: was there any difference in accuracy between various types of GPS devices?

To find out, ckdake and I took 10 GPS devices–including 2 wristwatches, 2 bar-mounted units, 3 smartphones, 1 GPS-equipped helmet camera, 1 handheld device, and even a tablet–to a local quarter-mile track to see how each performed. We did our best to mount each unit according to its normal configuration; that is, wristwatches on a wrist, bar-mounted units on the bars, etc. All were rigged to a single rider (me!) and the test started and stopped at the same point on the track after riding 10 laps (2.5 miles). I stuck to the middle of lane 1 (thanks for the velodrome tip Chris!) and each GPS was started (but not moved) one at a time. We didn’t test timing on the devices since each unit is designed to sync time with the GPS satellites themselves, which meant we wouldn’t need to start and stop all devices at the same time.

Here are the results, ordered by distance accuracy.

Device Distance Error
iPhone 5 (Strava) 2.5019 0.08%
Asus Android Tablet (Strava) 2.5124 0.50%
Garmin Forerunner 405CX 2.5208 0.83%
Magellan Cyclo505 2.5239 0.96%
iPhone 5 (Garmin Fit) 2.5328 1.31%
Garmin Edge 500 2.5334 1.34%
Garmin Fenix2 2.5501 2.00%
Nokia Lumia (GPS Logger) 2.5542 2.17%
Garmin VIRB Elite 2.5795 3.18%
Garmin 60CSx 2.2529 -9.88%

Looking at the animated graphic at the top of this article, you can get a sense for another measure of accuracy–basically the tightness and “correctness” of the ride data. The actual route hugged the inside lane for each lap, though you can see some of the data veers toward the inside of the field and the edges in some cases (click here for an interactive plot). Subjectively, here’s how I would rank the accuracy based on the route plot:

Top 5: Asus Nexus Tablet (Strava), Nokia Lumia (GPS Logger), Garmin Fenix2, Magellan Cyclo505, and Garmin Forerunner 405.

Bottom 5: Garmin GPSMap60CSx, iPhone 5 (Strava), Garmin Edge 500, iPhone 5 (Garmin Fit), and Garmin VIRB Elite.

Interesting to note that the most accurate in terms of distance are not necessarily the most accurate at plotting route data. Keep this in mind when using GPS to map trails.

Accuracy

Overall, the error rate is pretty low–around 3% or less for all but one device. Still, only 4 out of 10 were within 1% of the actual distance. On average (if we throw out the Garmin 60CSx) each device is off by about 1.4%, which is probably a good number to assume whenever analyzing your own data.

Error Direction

Surprisingly, all but one of the devices over-reported the distance, which either means our track is slightly longer than we assumed or something else is going on. In my own experience I’ve noticed most GPS units report distance on the high side (for example, clocking 104 miles in a 100-mile race), and perhaps it’s by design to make consumers feel faster/stronger than they really are. Product engineers know the device isn’t completely accurate so why not just estimate everything on the high side to keep riders happy? :)

Another more serious possibility is that distance was added to each track during the time it took us to start and stop all the devices during our test (you can see this in the lower right corner on some of the plots above). Basically if you take pretty much any GPS, hit start, and set it on the ground, after a few minutes you’ll find that your GPS has logged several feet of distance without moving.  How is this possible?

GPS units never know exactly where you are located–they’re only accurate to within a few feet. So each time a GPS checks with the satellite, it’s calculating a slightly different position, even when you’re not moving.

Driving Factors

gps_test_overlay

Perhaps one of the biggest misconceptions about GPS accuracy is that it’s all about the chipset (like the SiRFstarIII) in a particular device. While it’s true that some GPS chips are more powerful and/or sensitive than others, there are many, many factors that can affect distance calculations.

But let’s stick with the idea that chipsets affect distance accuracy for a moment. Two of the top four GPS units in our distance accuracy test are regular old smartphones that determine location not just with GPS but also using wi-fi and cell tower signals to triangulate a position. And the Magellan Cyclo505–#4 above–is also wi-fi enabled, though we don’t know if it’s actually using wi-fi to improve location accuracy. Still, having more sensors available to calculate location isn’t a guarantee of accuracy–the Garmin Fit app on an iPhone 5 ended up middle of the pack in our distance test, and the Nokia Lumia smartphone ranked 8 out of 10.

So what the heck happened to the Garmin GPSMap60CSx–it was off by nearly 10%?! There’s another factor at play here, and it’s known as polling frequency. Basically, GPS units check in with the satellite on a regular basis to get the user’s position and save that information, along with the time, to record your ride. Many apps and GPS units allow you to set the frequency yourself. For example, if you record your position once per second, you’ll get better data than if you record only once per minute. The tradeoff is more frequent polling will drain your battery faster and fill up your memory quicker.

garmin_gpsmap60_points

In the case of our track test, the GPSMap60CSx was set to record much less frequently than the other units, resulting in “cut off” corners that significantly shortened the distance (remember, a straight line is always the shortest distance between two points). Fortunately this is an easy fix and has nothing to do with the accuracy of the unit itself.

This is what more frequent polling looks like (specifically, 1 point per second):

garmin_fit_points

Some Garmin units (and perhaps units from other GPS manufacturers as well) have a “smart polling” option that doesn’t have a set polling frequency. Instead, the GPS records a point only if it’s not in a straight line with the point before it. A couple of the units we tested used this method which you can see below. In this test smart polling didn’t seem to affect accuracy but for a less-regular course (say, a twisting MTB trail) the GPS may have trouble keeping up with the rider’s constantly-changing vector.

garmin_fenix2_points

Software Manipulation

One final factor in our GPS distance accuracy test is the use of post-ride software processing. Basically if the GPS data is uploaded to a website (Strava, Garmin Connect, MapMyRide, etc.), chances are that the data will be manipulated. This is particularly true for elevation data (which we’ll discuss in a follow-up post), but I suspect even distances are being tweaked behind the scenes for some of the devices we tested.

In particular, it’s either incredibly lucky that the Strava iPhone app got within 0.1% of our target distance or that Strava is guessing (correctly) that our “workout” occurred on a quarter-mile track and is adjusting distances accordingly. Looking at the trace from the Strava iPhone app, it’s easily the messiest and least “tight” trace which, again, suggests it was either lucky or is making distance adjustments behind the scenes. The fact that the second-most accurate distance tracking also came from the Strava app but running on a low-powered Android tablet lends some credibility to the latter suggestion*.

Conclusions

This is by no means a definitive GPS distance accuracy test. In fact, if we conduct this test again (which we probably will at some point), my hypothesis is the ranking will be completely different. And aside from the track test, a test in an area with zero cell phone or wi-fi signals over a known distance (not a quarter-mile track) could help isolate the additional sensor effect and the software manipulation issues. Bottom line: if you’re choosing a GPS device or app for clocking your rides, don’t focus too much on accuracy… they’re all pretty good, but none are bulletproof.

* Being curious, I tested the theory that Strava is recognizing track workouts–and modifying them–by uploading raw data from one of the other devices used during the test. The result: no change in the distance. Still not definitive, but that theory is looking shaky.

Yesterday pootle meant I struck gold (or how not to let a creak spoil the ride)


Blue skies – a break in work and the dilemma about whether to go road cycling or mtb’ing (some dilemma)

Well it was fab … well apart from the niggle you get when something on the bike is not in perfect synchronous perfection with the rest. Those that read this blog will know I love my ti brides (titanium lynskey bikes – a Cooper road bike and a Ridgeline SL 29’er) but the 29er is being a bit naughty.

Well the crank/bottom bracket needs some timeout on the naughty step (not the owner of course)/ The chain side crank keeps on working loose and then there is the slight creak whenever I stand up and give it some torque. Eeeek Nnnnnnk Eeeeeek Nnnnnnnk. I have taken to carrying the large allen key with me to do a mid ride tighten but what I need to do is go into my LBS and get some lock grease.

But I put the noise out of my mind – the rohloff is particularly sweet in terms of little transmission noise – and rode. The only moment i stopped was to strip off a layer and then to stop at the end of a descent to scoff down a wee bar of flapjack goodness. When i got back i loaded up the gps and bang 

2 x KOM and a smattering of places

Screenshot 2014-09-10 20.30.14

Now most people don’t care about these things but i felt a small tinkle of happiness being a competitive over 40 has been of an athlete. But i don’t expect this to last long as the person I scuppered is a Strava KOM poacher of renown – I expect my glorified basking in the sun victorious feat to last at least 10 hours.

Screenshot 2014-09-10 14.54.17

this descent is a nice fire road/trail mix that was actually feeling quite tough in the dry – it feels smoother when slightly damp but I guess that is the friction.

Off for a ride tomorrow – might just make it a roadie day as playing 5 a side tonight and my legs probably won’t be working.

Strava gets the link up with Garmin ….. Eventually


OLATHE, Kan. (BRAIN) — Users of Garmin’s GPS-powered cycling computers and its Garmin Connect website will soon be able to more seamlessly sync their data with third-party fitness aps and websites including Strava, MapMyFitness and Endomondo.

Now users can link their Garmin Connect account to their Strava account, so that activity data will be viewable on Strava immediately after the data is uploaded from the GPS device to Garmin Connect. MapMyFitness (including MapMyRun and MapMyRide) and Endomondo syncing is expected soon.

The company said it is working on more partnerships with other third-party applications.

a warm,wild, wet and windy winter day


Whilst the rest of the country deals with flooding and storm damage (and I have sympathy for their plight) but we in Scotland make the most of the weather and so today was Kitesurfing day. Initial plan was too leave early and get a session in before the rain came in at 1pm but the funny thing is that when the wind is westerly the island of Arran off the coast seems to deflect the worst of the weather especially when it is howling.

Barassie beach just to the north of Troon harbour

Kites Best TS 8m and Best Cabo 6m – Got down later probably after 12 then rigged up. Firstly pumped up the 6m kite as it felt like a good 28-32 knots …. but then the wind lulled before i even left the grass so pumped up the 8m (now officially my big kite as i hate cruising on big kite days) and went down to the beach as the clouds passed sucking in even more wind in its tail … so ran back shoved the 8m in the car and out again on the 6m.

Wind was gusty but good 1908936_10152260919789993_1081725259_oyou can see the stats here 18knots gusting 32 when I got on the water and then for the next hour was 17 gusting 28 …. 17 was a bit low for the 6m but in the gusts it was great.

Screen Shot 2014-02-09 at 19.18.08I took the new board down it is a Cabrinha Tronic 137 and it is amazing in the choppy conditions and with the bigger fins (than my last board) it kites a lot flatter so the spray is a bit cleaner and not one eyeful of spray into your eyes …. i love it straight off and the H1 pads and straps are fantastic so comfy.

Out with the old Slingshot Lunacy on the left and in with the new Cabrinha Tronic on the right

I tried a few little speed sections between the waves and the board felt fast – but only 21.7 knots max so i am sure the 8m will be quicker as the Cabo sits quite deep in the window (well it is a wave kite)


what 5 a side looks like on gps


My friend Tom asked what 5 a side looked like on a gps or Strava … well here Tom this is for you.

Screen Shot 2013-10-06 at 09.51.41


pretty accurate for something that has a 5m accuracy. It isn’t telemetary but it gives a good idea of the pitch covered – a full 11 a side pitch would be much more accurate in terms of area covered.

i use a Garmin Fenix HRM GPS – like this one here – fantastic – esp now they have dropped in price

Strava is bad today


went for a run and this is the picture I see after putting it into Strava so I think the Strava gremlin is out trying to change from Ride (default) to run.

Screen Shot 2013-07-20 at 13.30.08


eventually i import it and Whoah something is wrong (besides my lack of pace which is expected) …. the gps track on the Fenix is way out.


bad gps track
bad gps track
Screen Shot 2013-07-20 at 21.31.37
what the track should have looked like

So what could cause the track to be so bad on a cloud free day – was only wearing a vest so that can’t be to blame. So i googled the possible reasons.

Instead of the straight line, the satellites in the sky above you track your route through a series of plotted dots that’s typically within 10 feet of your GPS watch. But that 10-foot margin of error can add up over the course of 26.2 miles. Two dots could weave 10 feet inside and outside of that “straightest path possible” that the USATF certification ensured, which will add to the total distance on your watch.

Other factors can mess with your GPS, too, including:

  • The number of participants at big races often make going the “shortest path possible” impossible for most runners. Things like taking wide turns can add distance to your total.
  • Tree cover could disrupt the GPS readings and make it slightly less accurate.
  • Veering off for a water stop, bathroom break or to run over and high-five your kid will add distance to your total.
  • Starting the GPS in the corral rather than at the start line adds pre-start line distance to your total.

THE BOTTOM LINE

Snow, who doubles as a running coach, praises the usefulness of GPS watches in training. Few runners would disagree.

————

So no answer but changed software to latest version and there is a nice feature that will now read the ANT+ speed cadence sensor …… hooray.

Changes made from version 3.30 to 3.40:

  • Added full support for GSC 10 Speed/Cadence bike sensor to allow calibration and display speed (options found under Setup > ANT Sensor > Bike Spd/Cad, Setup > Fitness > Bike Speed)
  • Added ‘UTC (24 hr)’ option to alternate time zone list. This option displays UTC time in 24-hour format regardless of system settings
  • Added support for ‘Alt. Zones’ to become a data page option

So will see how good the new version is – off SUPing tomorrow so we will see.

best apps for training


With more and more people buying smartphones and the proliferation of training apps now available for them, it’s never been so easy to accurately keep track of your training. Gone are the days when you kept track of your training in a notepad, with careful handwritten notes. ROAD.CC

The latest generation of training apps makes it far easier to record and analyse your training, as well as setting goals and targets and reviewing previous performances. We’ve chosen 10 of the most popular apps so you can kick start 2013 with a digital thump.

And with smartphones now offering GPS maps and large colour screens, many cyclists are opting to use them in place of a dedicated cycle computer. Either mounted to the handlebars or safely stored in a jacket pocket, recording your ride on a smartphone is now common.

Garmin Fit

Garmin’s Fit app allows you to use your iPhone or Android smartphone as a training tool. It can be used for various sports, and one you’ve finished it uploads your session to Garmin Connect. It costs 69p but Connect itself is free to use. Once there you get all the important data and there’s useful functions like a calendar that totals your hours of riding each week, giving you an easy way of tracking your training progress.

Available for iPhone and Android.

Cyclemeter

This app functions as bike computer but can also store your route in Google maps, which can then be exported to social media networks like Twitter nad Facebook. A calendar makes it easy to see your recent rides at a glance and help to plan your next ride, and your favourite routes can be saved for future use.

www.abvio.com/cyclemeter/

The Athlete’s Diary

You can easily keep track of training rides with graphs of the total distance and time accumulated with this app. Information is clearly presented with the main screen a log showing some of your latest rides, so you can see at a glance how training has been going. You can also search your recorded rides too. Data is manually entered, but there’s an Autofill option for rapid entry. Only available for iPhone and costs $19.99.

www.stevenscreek.com

SportsTrackLive

This app lets you share and compare in a number of sports. As well as speed, distance, time, it works with compatible heart rate monitor straps and cadence modules. You can replay tracks on Google Maps, share with Facebook and Twitter friends, and export to the SportsTrack website. It only works with Android phones and costs £2.99.

www.sportstracklive.com

Training Peaks

A popular choice for cyclists, as it stems from Joe Friel’s TrainingBible series of books, Training Peaks is a very comprehensive training package that offers unlimited detail and control of your workout data. There’s training plans that can be bought and downloaded, taking the guesswork out of training, and there’s the novel Virtual Coach too. Works for Android, iPhone, iPod and iPad.

http://home.trainingpeaks.com

CoachMyRide

CoachMyRide, only available for the iPhone, lets you set goals and choose training sessions from a library of 105 included in the app. And for analysing sessions, Lionel Reynaurd is a professional cycling coach is available to offer feedback and share his knowledge. AS you progress in your training and you get fitter, the app easily adapts your training to suit.

www.coachmyride.com

Endomondo

Endomondo is a community based workout app that lets you challenge friends and analyse your training. A clean and clear display shows distance, speed and time when cycling, and you can customise what is show on the screen. Once you’ve done a ride you can upload to the website where you can create groups for your friends to share rides, and share through Facebook. With a Bluetooth heart rate strap you can add heart rate data to your training data. It’s free and works across all platforms.

www.endomondo.com

Kinetic

Described as the “Swiss army knife of GPS tracking and timing” Kinetic lets you organise your training sessions by activity or event. It can set goals and monitor your progress against a predicted finish time. Voice notifications chart your progress in real-time. Kinetic GPS Lite is free, while the full version is $3.99.

http://kineticgps.com/

Cychosis

Rather than automatically logging your ride data, which is fine if you want to use your smartphone on the bike, Cychosis differs by requiring you to manually enter data from each ride. So you can leave your phone safely at home or not have the battery drained in 5 minutes by the constant GPS usage, and enter ride information form your cycle computer when you’ve finished your ride. And if you love your spreadsheets, you can export ride data to your computer.

www.cychosis.com

Strava

One of the most popular apps is Strava, because of its unique feature of letting you compared times on ‘segments’ of road. Users can create segments themselves, and any person that has ridden along this segment is added to a leaderboard. So you can see who is fastest on your favourite climb for example. With a community revolving around this feature, it adds a competitive element to training on your own. A suite of power and heart rate analysis tools makes it a good option for those who want to take their training seriously. Available for iPhone and Android.

Garmin Fenix – software update 2.9 – suddenly becoming a fitness watch


I made a little observation the other day on the Garmin Fenix about how it was tracking even in the city

I made a not then that the frustrating part was the inability to use it in the gym very well (there is a section where you need to set it to track by distance and not by time otherwise you get no summary) but now with version 2.90 of the software they have addressed some of the problems.

First, they’ve added a new mode – INDOOR – which turns off the GPS and allows you to record activities while inside. There are new data pages for this mode – I have data pages set up already for running cycling and kitesurfing and at first I was a bit peeved that i had to enter everything again. But then if I am indoors I do not need to know the grade of hill I am on or the elevation gained so the setup is a bit cleaner with less data.

The other change for indoor mode that counts is that they are now supporting the ANT+ footpod. Mine of course is on loan along with my FR60 to a friend so not much use for me here in Istanbul and my treadmill runs but i will reclaim it and use it when I go home. It will also be good outdoors and will add a step count and cadence profile to my runs.

Apparently whilst the speed distance cadence ant+ sensor is supported – it only works with cadence. So turbo training sessions are a bit of a pain – for me this is less of an issue as I have an Edge 305 but for a 1 item / multisport solution it is lacking. Saying that – the fact there have been 3 quick software updates means they are listening and changing so expect that to be added soon.


Strava Addict – here are some sites that let you get more


The Multiple Ride Mapper

This great app / (website) pulls in all of the rides and runs you’ve ever logged on Strava and displays them on one map. Simply copy and paste your athlete number into the box and be amazed as it pulls in every ride and maps it. If you are struggling to find your athlete number then hit profile in strava and it will show a number in the address bar – this is you.

The website uses opaque lines so if you’ve ridden or run certain roads many times, you will end up with a darker line, whereas roads you’ve only ridden once will be more pale. The map is clickable, and the list on the left hand side takes you back to the ride screen on strava.com if you wony to see an indication of frequency then set opaqueness down to see all your routes clearly.

20121015-212025.jpg

Here is a map of some of my rides over the last few months – some road, a few mtb and one or two commutes or runs.

KOM Notifier Service

Created by the same author as the multiple ride mapper above, Jonathan O Keefe, the KOM notifier service will give you detailed notifications about any changes to your KOMs, or indeed any changes in the top 10 positions.
20121015-214123.jpg
Segment details

Yet another brilliant bit of coding from Jonathan again, Segment Details can be accessed separately as a standalone thing, but it is also linked from the Strava KOM Notifier Service, above.

This one is really useful for tracking the history of a segment – who’s been KOM in the past, when did so and so take it, how many people have ridden it, what’s the average time taken etc.

RaceShape.com

RaceShape is essentially about analysing the differences between people riding a segment. Say you lost your KOM or if running your CR to someone – you can use this tool to analyse where they were quicker, and so help you to develop your strategy. It works by analysing how the gap changes between two riders, and works with segment data from Strava or Ride with GPS.

Here is a screengrab of a flat canal path section that I took my road bike on – it analyses your time over distance and although I am 3rd on this section I can see that in the first wee bit of the trail where I was chatting to someone with a flat tyre – suddenly that is the 40 sec gone. Although slower than no 1 and possibly no 2 it was close.
20121015-212617.jpg

Using no 2 as a baseline you can see where I level out and we are quite matched. By comparison my friend Keith did the route and you can see the slope of his pace and where I eventually catch up and pass. So now that I know this is a section I might just burn it along here (although not on a weekend when there are so many dog walkers perhaps.

Veloviewer

It gives you more stats to play with and get twitchy about than you might ever want. Dig around and you’ll discover a great new way to explore the segments you’ve done, and get ideas about which ones you want to revisit.

Tip: Click the table column headings to sort on that column. You can sort this on average speeds or overall length or steepness and so on.

You’ll discover segments you’ve already done, but never realised were there, prompting you to think about targeting them for a serious effort.

Here is a mtb climb once again using Michael D as the base line and my pal Stuart who is notionally behind me. Interesting to see I started fast but burnt out a bit on the muddy section with the big puddle. I could pretend it may have been dry on the days the others did it or it could just be that I was tired. Stuart and I swap the lead a lot towards the end. Does really let you see where others or quick and where you are slow.

20121015-212809.jpg

Garmin Fenix


Just taken the plunge and ordered this … Off to Istanbul for a month and will review the watch in the next week or so.


the Garmin Fenix

The Garmin Fenix is the first GPS navigator + ABC (Altimeter, Barometer & Compass) wristwatch to include comprehensive Garmin GPS navigation. Developed together with professional mountain guides and designed for the serious expeditionist and outdoor enthusiast, Fenix is the hands-free outdoor navigation tool that guides you with confidence through demanding mountain environments.
You can create and follow routes and mark up to 1,000 waypoints which you can navigate with ease. In addition Fenix can store up to 10,000 track points, recording a track log – a GPS “breadcrumb trail” – as you move. You can then use TracBac to show you the way home. Naturally, as a navigating GPS+ABC watch, it also includes altimeter, barometer, 3-axis electronic compass and temperature sensor. Rugged, stylish and waterproof to 50m, it’s also a functional, accurate, well featured timepiece, as comfortable for everyday wear in the city as it is off the beaten track.
More than just a navigational tool, the Fenix provides comprehensive real-time performance monitoring for athletes such as trail runners and ski mountaineers. With lap and autolap function and important performance data (e.g. distance, vertical speed and pace), ambitious mountaineers can keep track of their progress during their outdoor training activities. Equipped with ANT+ and Bluetooth, the Fenix not only shares data wirelessly with other units, it’s also compatible with Garmin’s optional premium heart rate monitor or speed/cadence sensor for distance, speed and cadence while on a bike.